📈 Reports & Analytics
Reports & Analytics
Deep insights into your business performance — analyze sales, tickets, inventory, and quotations with interactive charts and exportable reports.
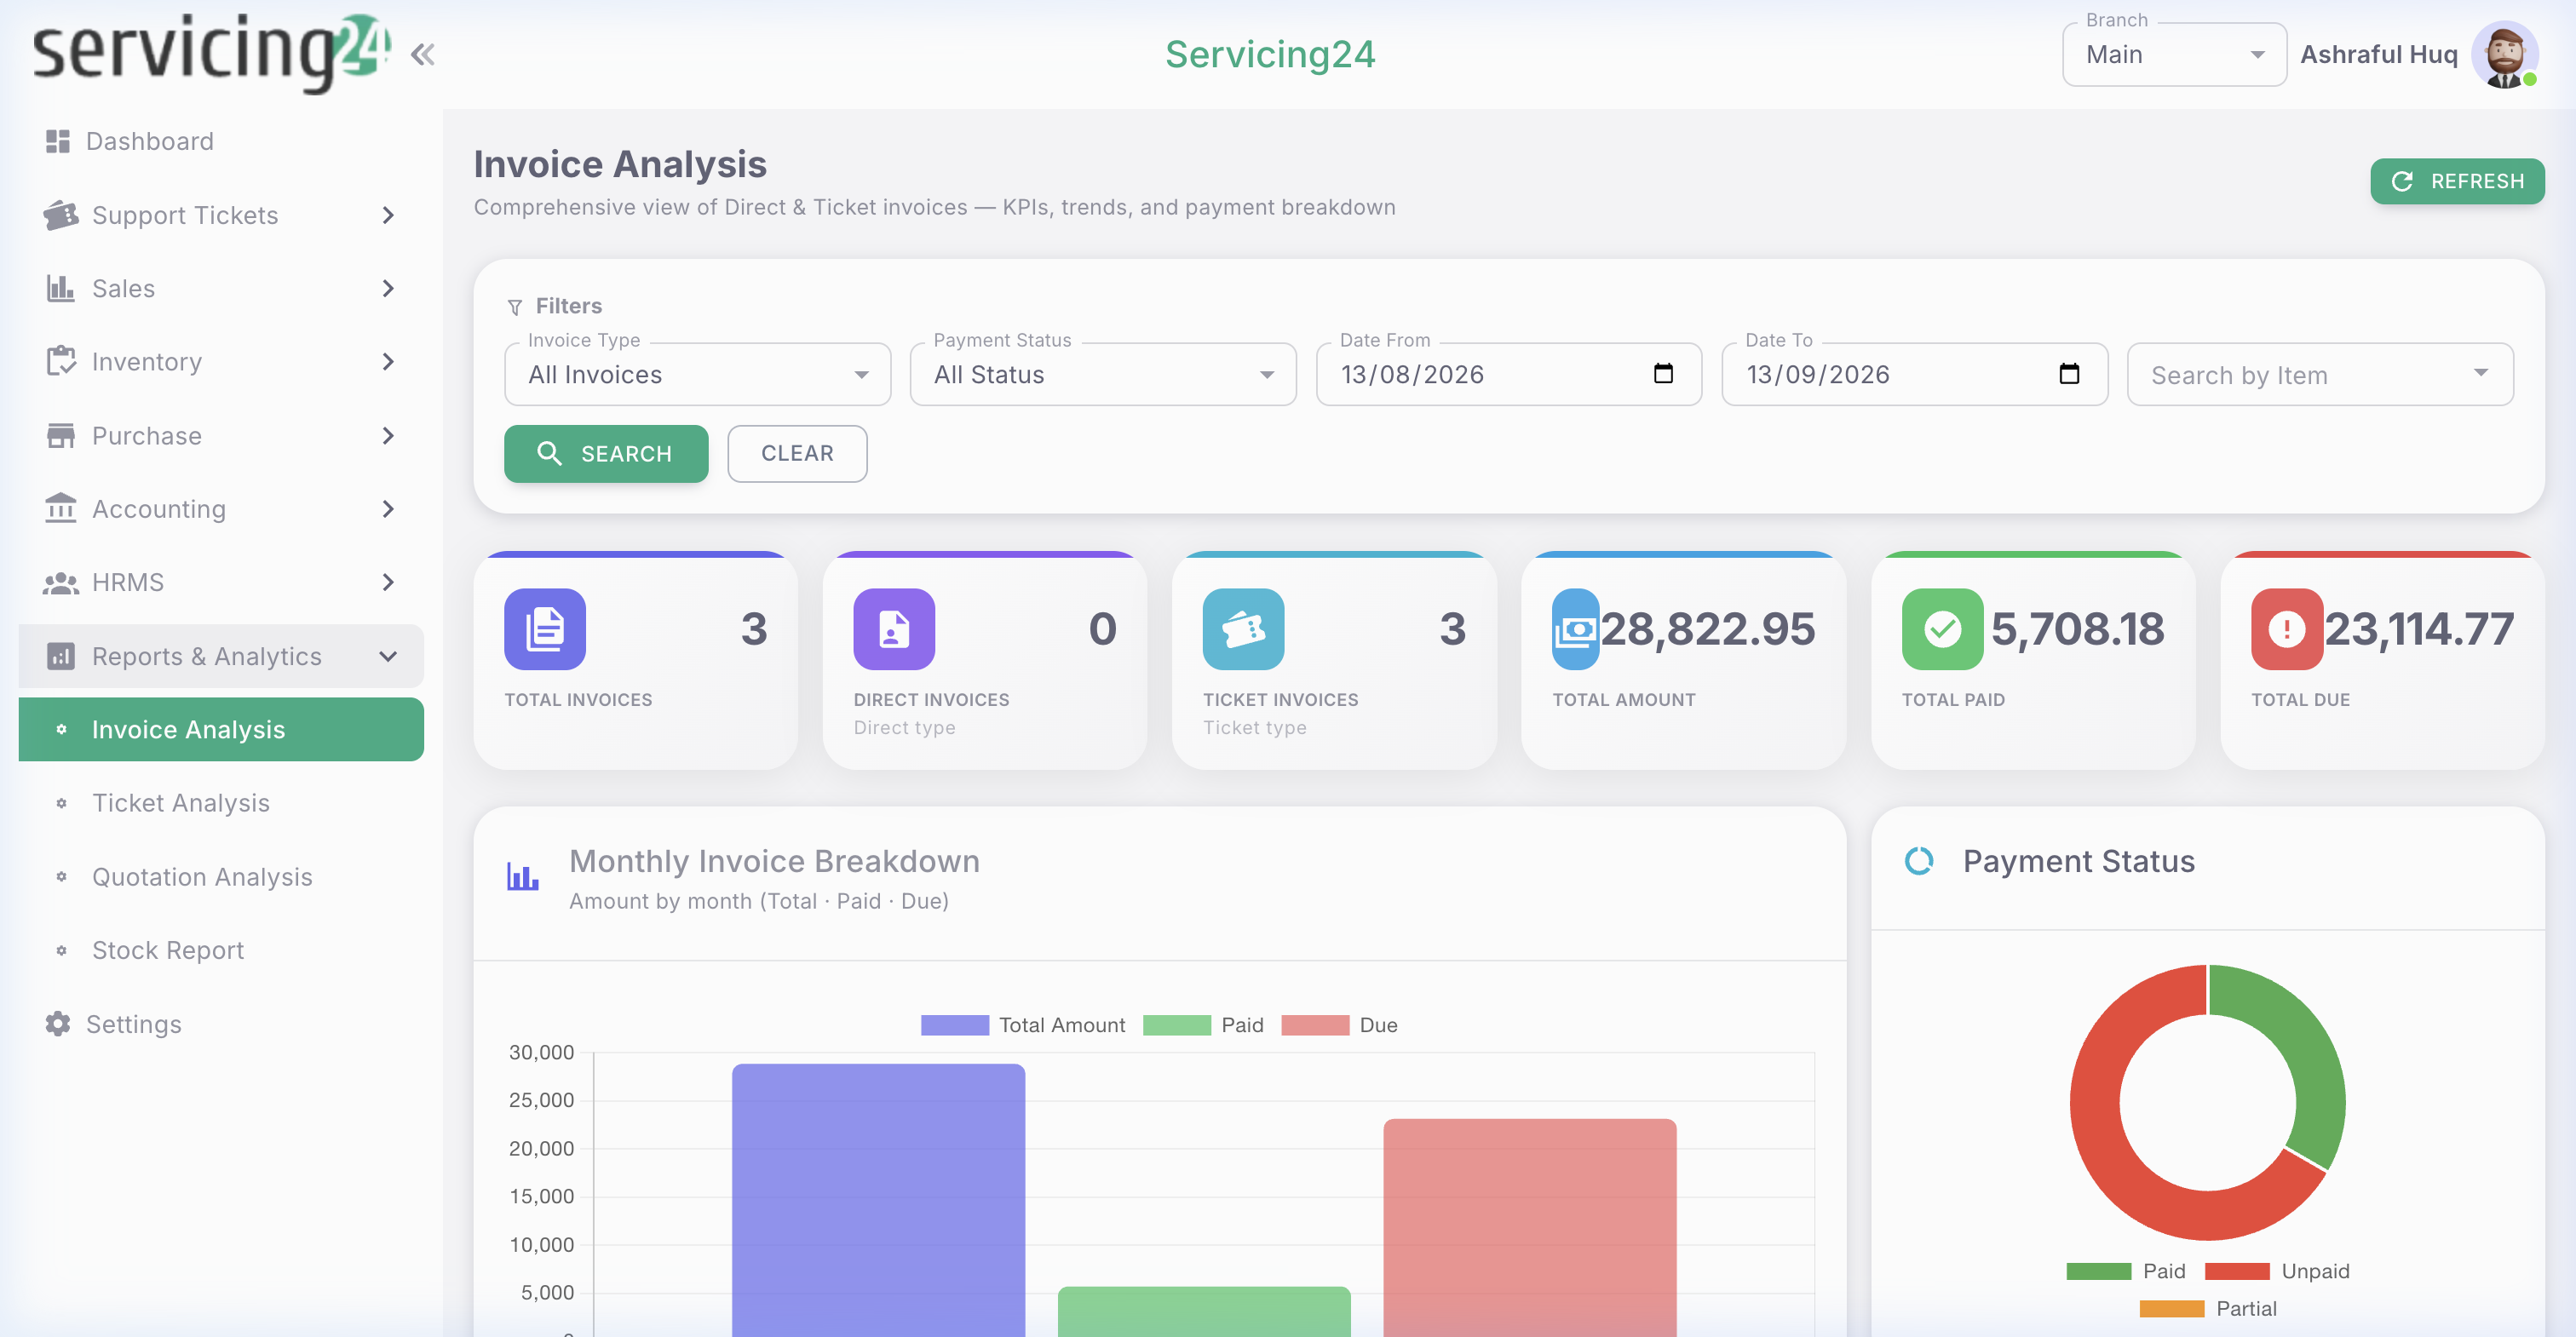
📸 Analytics — interactive charts and filters for deep business insights
Analytics Overview
The Reports & Analytics module provides data-driven insights through charts, tables, and exportable reports. Use these to make informed business decisions.
🧾
Invoice Analysis
Sales trends, revenue by period, top customers, and payment analysis.
🎫
Ticket Analysis
Ticket volume, resolution time, agent performance, and status distribution.
💰
Quotation Analysis
Quote-to-invoice conversion rates, top products quoted, and win/loss analysis.
📦
Stock Report
Inventory valuation, movement summary, and low-stock items.
NoteAnalytics is accessible to all users by default. Administrators can restrict access under Settings → Roles & Permissions → Analytics Access.
Invoice Analysis
Analyze your sales and revenue performance over any time period with detailed invoice analytics.
1
Go to Reports & Analytics → Invoice Analysis
The dashboard loads with the current month's invoice data.
2
Set your date range
Use the date filter to select any custom period — daily, weekly, monthly, or yearly.
3
Read the revenue trend chart
The main chart shows total invoiced amount over time. Spot seasonal patterns, growth trends, or dips.
4
Top Customers analysis
See which customers generated the most revenue in the period. Use this for customer segmentation and priority service planning.
5
Payment status breakdown
The pie chart shows the split between Paid, Unpaid, and Overdue invoices — monitor collection health.
6
Export to Excel
Click Export to download the full invoice analysis dataset for further analysis in Excel or sharing with management.
Ticket Analysis
Understand your support team's performance and workload distribution with ticket analytics.
1
Go to Reports & Analytics → Ticket Analysis
View ticket metrics for the selected period.
2
Monitor ticket volume
The volume chart shows how many tickets were created per day/week. Identify peak periods to plan staffing.
3
Track resolution time
See the average time to resolve tickets. Improving this metric directly improves customer satisfaction.
4
Agent performance
A breakdown by agent shows how many tickets each team member handled and their average resolution time.
5
Status distribution
See the percentage of tickets that are Open, In Progress, Resolved, or Closed to understand your backlog.
6
Priority analysis
Analyze the distribution of High/Medium/Low priority tickets to ensure urgent issues are handled first.
TipShare the Ticket Analysis report with your team in weekly meetings to drive accountability and continuous improvement.
Quotation Analysis
Measure how effective your sales team is at converting quotations into actual sales.
1
Go to Reports & Analytics → Quotation Analysis
See quotation metrics for the period.
2
Conversion rate
The most important metric — what percentage of quotations were converted to invoices. Benchmark and improve this KPI.
3
Top quoted products
See which products and services are most frequently quoted, informing inventory and pricing decisions.
4
Lost quotes analysis
Review quotations that expired or were rejected to understand where and why you're losing business.
5
Sales rep performance
If you have multiple sales staff, compare their quotation volume and conversion rates.
Stock Report
Get a comprehensive view of your inventory valuation and movement for any period.
1
Go to Reports → Stock Report
View the stock report for the selected period and branch.
2
Inventory valuation
The report shows the total value of your stock at the selected date — essential for financial reporting.
3
Movement summary
See total units purchased, sold, transferred, and adjusted in the period — a complete stock reconciliation.
4
Low stock items list
A list of all items below their minimum stock threshold, helping you prioritize reordering.
5
Dead stock analysis
Items with no movement in the selected period — these may need to be discounted or written off.
6
Export
Export the stock report to Excel for month-end closing or management reporting.